Getting a hearing test is a smart move – hearing exams can tell you precisely how well your ears are functioning. If hearing loss is found, the results of your testing can help provide a hearing solution customized to your specific hearing parameters.
Once you have taken a hearing exam, the test will generate a graph of the results called an audiogram. Audiograms chart frequencies of sound correlated with your ability to hear them. When you first see your audiogram it may seem a little cryptic at first, but understanding all the factors measured will help you understand how an audiogram displays your hearing.
Frequency of Sound
Every sound has a frequency, commonly referred to as its “pitch”, which is measured in Hertz (Hz). Normal human hearing can detect a wide range of frequencies, from around 20Hz to 20,000Hz. Sounds below 500Hz are considered to be “low frequency” sounds – like an animal’s growl or rolling thunder. At frequencies above 2000 Hz a sound is considered to be “high frequency” – sounds like a tea kettle boiling or a soprano’s song.
Most human speech falls in the range of 250Hz-6,000Hz. Most of the important sounds in our lives fall within this range as well. A hearing test will test your hearing throughout this range, as well as from a little above to a little below – usually 150Hz-8000Hz.
Intensity of Sound
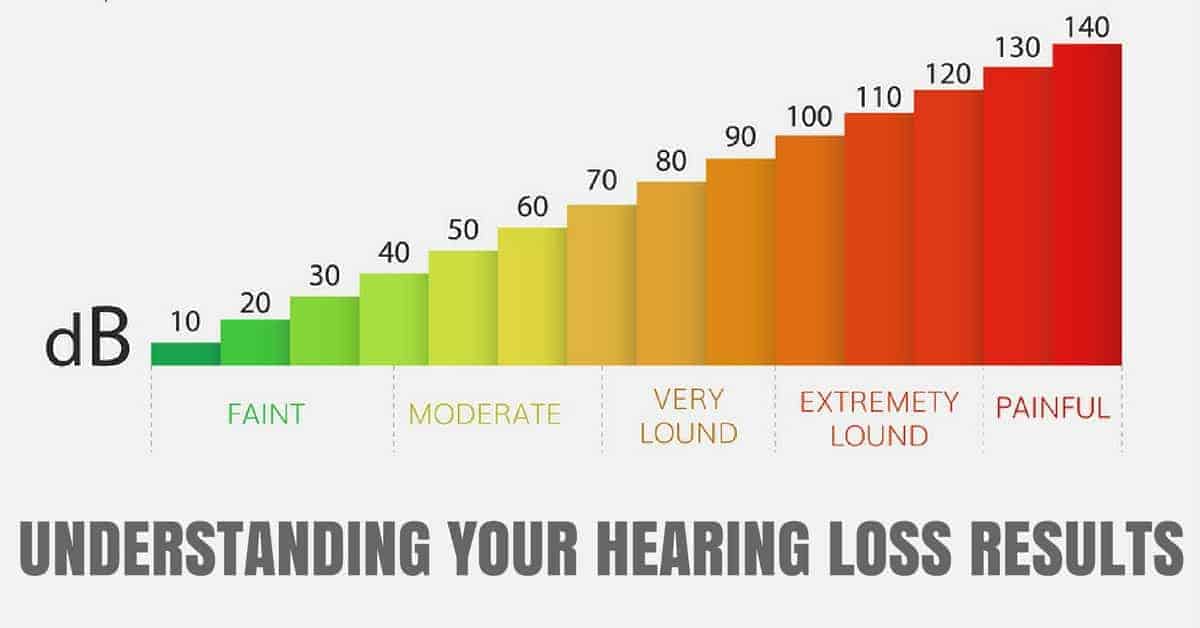
Your hearing test measures how well you hear frequencies by playing tones at varying intensities. Intensity is the loudness of a sound, as measured in decibels (dB). The loudness of average human speech is around 50-60dB, while a quiet whisper is around 30dB. Around 70dB sounds can begin to seem loud, and at levels above 85dB they can cause damage to our hearing. While 85dB will damage hearing in 8 hours, 110dB sound will damage hearing in 5 minutes and any noise above 130dB can cause immediate and painful hearing loss.
The lowest decibel level at which you can detect a frequency at least 50% of the time marks your hearing ability for a frequency. While the level of 0dB represents the softest sound that can be heard by a human ear, healthy adult hearing should perceive sounds at levels of 25dB or greater. Your audiogram will chart the softest intensity at which you can hear various frequencies.
Hearing Loss By Degree
Through mapping the intensity of sound it takes for you to detect a frequency tone, your hearing specialist looks for hearing loss – the places where you cannot detect a frequency played at 25dB. Depending on when you can register the frequency determines the degree of hearing loss you have for that pitch. There are four basic categories of hearing loss, determined quantitatively:
Mild Hearing Loss – This means you can’t detect a tone at 25dB, but can hear it somewhere between 26-40dB.
Moderate Hearing Loss – This degree indicates you cannot hear a frequency at intensities below 40dB but can perceive it in the range of 40-69dB. At this level hearing loss impacts your understanding of speech and conversations.
Severe Hearing Loss – If you are unable to hear a frequency until it is played at 70dB, this marks severe hearing loss. Severe hearing loss at a wide range of frequencies cuts you out of hearing and comprehending normal levels of speech and everyday noise.
Profound Hearing Loss – the threshold for the greatest degree of hearing loss is being able to hear a sound only at intensities of 95dB or greater. The presence of profound hearing loss may require specialized hearing aids.
Red Ear, Blue Ear
Just as your audiogram maps your hearing ability by frequency, it also maps it individually by ear to detect differences between the two. On your hearing chart, a red line will represent the hearing of your right ear and a blue line will mark the hearing of the left ear.
These red and blue lines will also have symbols to indicate the method in which the ear was tested. The most standard testing, where tones are played by earphone into your ear canal, is called “air conduction testing”. You may also have your ears tested by a technique called “bone conduction testing” where a sound is transmitted through vibration to the bones of the ear. Results that come from air conduction tests will be marked as a “O” on your red right ear line and an “X” on the blue left ear line.
Hearing Wellness Solutions
Put all these factors together and you have the key to a nuanced, personalized solution to your hearing issues. At Hearing Wellness Solutions, we combine thorough hearing testing with a customer-driven approach to care, helping you navigate hearing loss and find the best choices for hearing your best. If it’s time for you to get an updated hearing exam, contact us today!